Project Overview
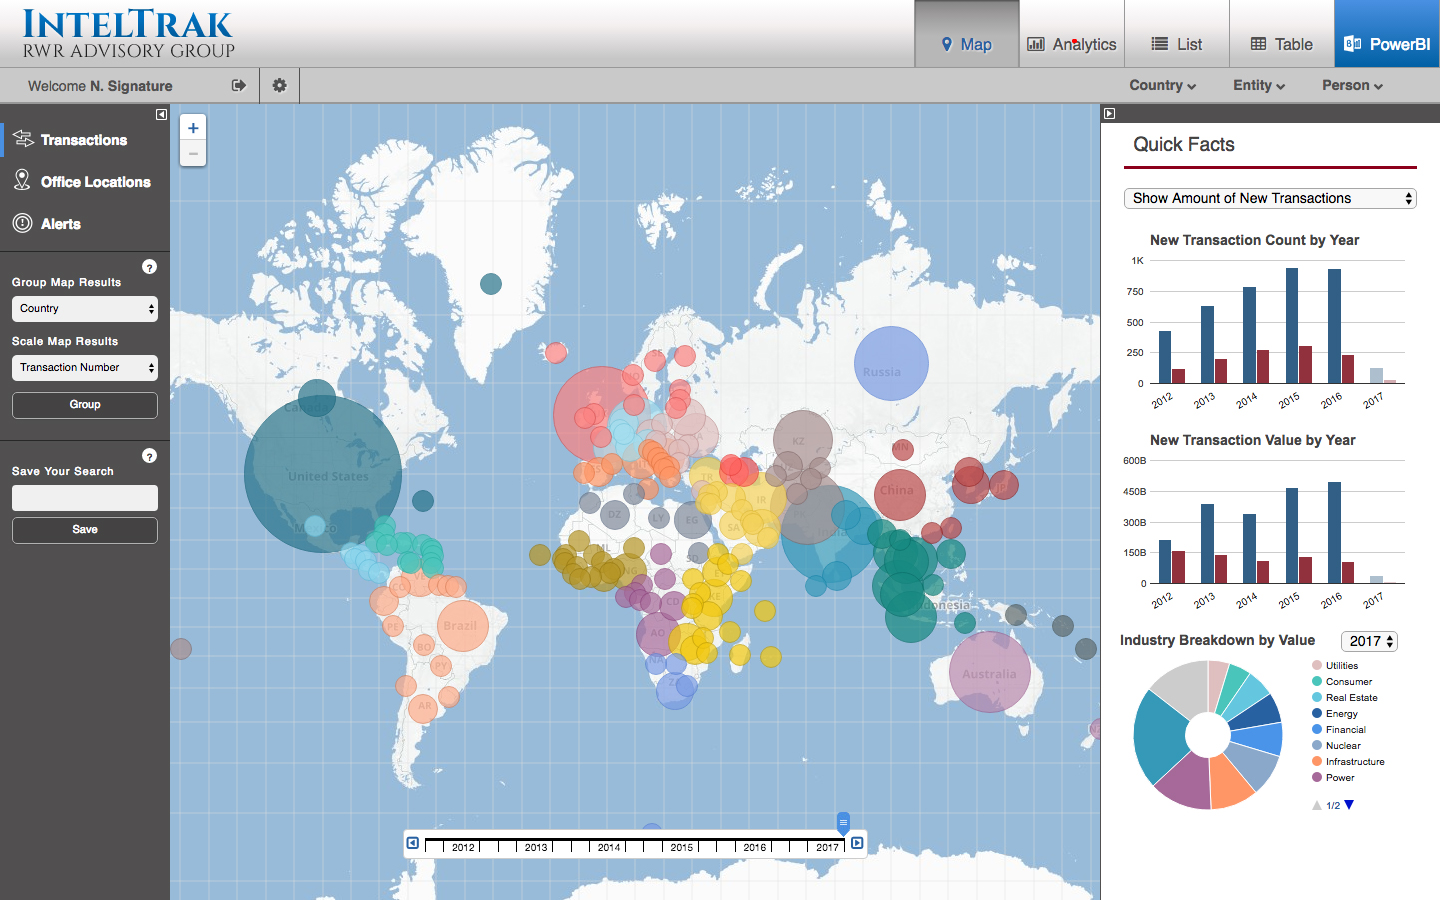
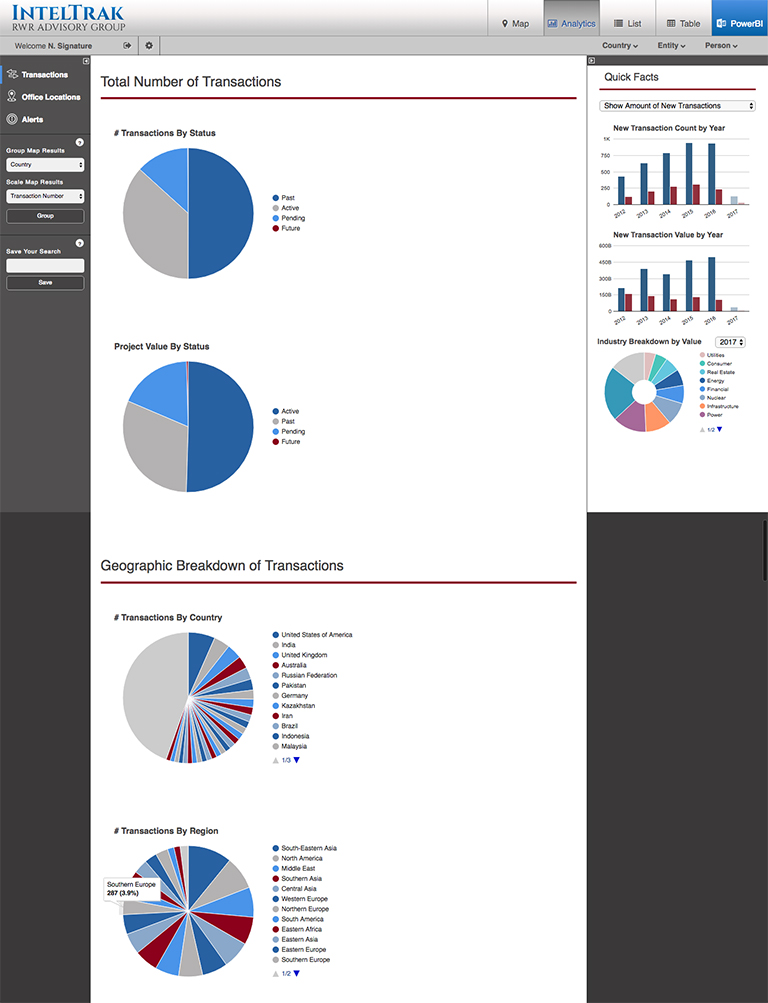
We created a data visualization application showing the business activities of various actors around the globe. These included government entities and private businesses.
The activities of these entities are both mapped and displayed in charts. The data provides insight into the operations of these entities for the US government and related groups.
Note: Design of this project did not take place with the help of any member of Green Mountain Design and Development.
IntelTrak
IntelTrak is a research tool meant to provide information on global business activities
Type of projectResponsive WebsiteIndustryGovernmentTechnologyJavaScriptWork completed for the clientData VisualizationsCustom Programming